

Cookies Notice
This site uses cookies to deliver services and to analyze traffic.
📣 Introducing AI Threat Modeling: Preventing Risks Before Code Exists

Unified risk and vulnerability management across application, infrastructure, and code quality scanners, with code-to-runtime actionable context
Automated security controls validation and assurance based on your organization’s SDLC policies, with actionable context from your CMDB

Risk Graph policy engine and developer’s guardrails at every phase: design, development (pull request), and delivery (build/deploy)


TL;DR – To help our customers secure their applications and software supply chains and improve their application security program efficiency, we’re excited to unveil all-new dashboards! The new overall and solution-specific dashboard tiles provide visual insights into important application security KPIs such as MTTR, risks over time, development velocity, material changes, etc.
Like your codebase, your security posture changes over time. Managing and tracking key performance metrics helps ensure you’re making data-driven decisions on priorities, strategy, and investment that will strengthen your security program. Apiiro automatically surfaces and tracks key metrics by integrating and analyzing security signals through deep, continuous code analysis and insights from both native and third-party security tools across your software development lifecycle.

We’ve made it easier and faster to get a pulse check on your AppSec posture right from Apiiro’s application security posture management dashboard. Here are five of our favorite dashboard tiles and how to use them to understand and improve your application security posture over time.
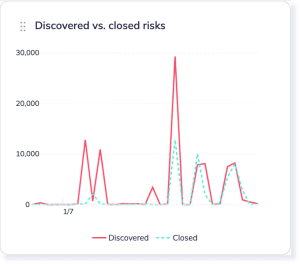
You can’t secure what you can’t see. And you can’t improve what you can’t track. This tile shows the convergence between open and closed risks over time. A risk is considered “closed” if it’s remediated, ignored, or accepted. Seeing the number of new risks identified—either from Apiiro’s native solutions or your third-party solutions—and addressed over time enables you to track secure coding and remediation trends, which is an important indicator of your AppSec program’s efficacy.
Fun fact: You can drill down into the Risks page for a specific date by clicking on the tile tooltip.
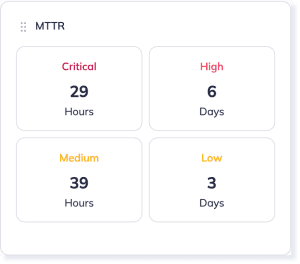
The mean time to remediation (MTTR) tile tracks one of the most telling AppSec metrics of all. This tile shows the average time between a risk being discovered and resolved, AKA your ability to efficiently mobilize your security and development teams to address application risks.
Many of our customers maintain SLAs for MTTR and strive to minimize their response time. With this new tile, you now have immediate insight into MTTR that can be filtered by a specific period of time and/or by specific parts of your application to see how your teams are trending.
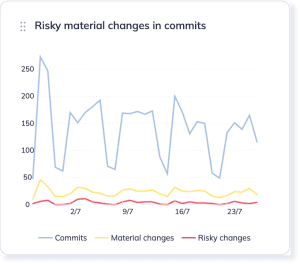
Not all code changes introduce vulnerabilities, expose secrets or sensitive data, result in misconfigurations, etc. A change might introduce a new entry point or data model, or it might alter an existing one—thus resulting in a material change—any change that has the potential to introduce risk into the application that is not a vulnerability. Automating material risk classification helps teams better prioritize, allocate resources, and effectively remediate risk.
For highly regulated organizations especially, tracking material changes may be a matter of compliance or noncompliance, but for any organization, tracking commits, risky changes, and material changes is an insightful way to understand development behavior, better allocate resources, and benchmark your team’s ability to avoid introducing new risk over time. Additionally, this snapshot can help determine when and where to create development guardrails that address patterns seen in risky/material code changes in your organization.
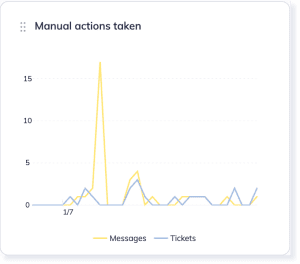
This tile aggregates the tickets and notifications for remediations and security processes triggered manually via the Apiiro platform. Understanding how Apiiro can help streamline notifications and ticket creation and monitoring the volume of triggers helps measure your program’s efficiency and optimize workflows based on risk impact to ensure you are focusing on the right risks.
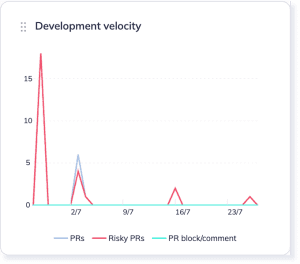
For even the most robust and efficient AppSec teams, manually reviewing all pull requests is impossible—that’s where automation comes in. This tile shows the impact of automating security in the context of new pull requests, how many are risky, and how many surfaced application security feedback via an Apiiro PR comment or block.
Seeing how Apiiro is automatically monitoring PRs for material changes and preventing critical risks from reaching production allows AppSec teams to gauge their shift-left security effectiveness and see the impact focusing on high business impact changes has on team efficiency. Tracking development velocity helps AppSec teams strategize and align resources, and engineering managers measure and Improve the performance of their development teams.
Existing Apiiro customers can dive deeper into the dashboards in our documentation (say that five times fast).
To see how Apiiro can help not only visualize your application security posture but to improve it—with efficiency enabled by deep code-to-runtime context—schedule a demo with our team of experts.

This site uses cookies to deliver services and to analyze traffic.